

Experience German engineering excellence with the Bosch Series 4 BPP300, a premium combined fridge freezer that delivers uncompromising performance for the modern home. Built with Bosch's legendary attention to detail, this appliance combines sophisticated technology with elegant design.
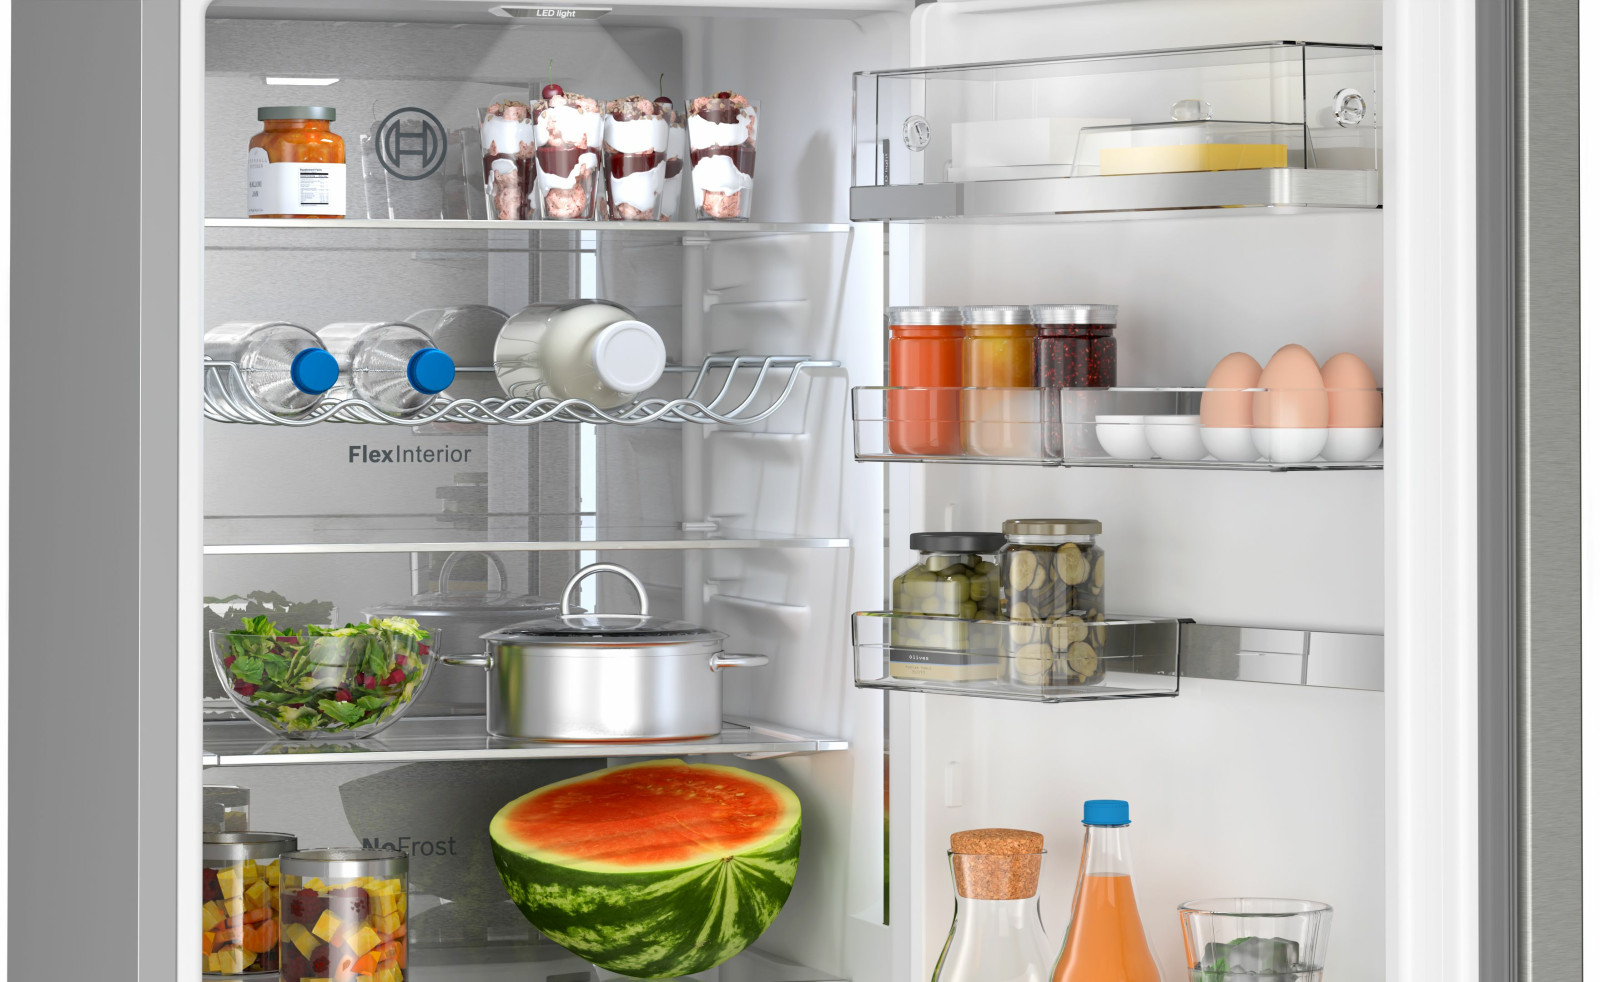
The BPP300 features a spacious 342-liter capacity, thoughtfully divided between refrigerator and freezer compartments. The advanced No Frost technology ensures consistent cooling throughout while eliminating ice buildup, freeing you from the tedious task of manual defrosting.
Design & Construction
- Finish: Anti-fingerprint stainless steel
- Installation: Free-standing
- Door hinge: Reversible right/left
- Control: Digital TouchControl
Performance
- Energy class: A++
- Annual energy: 260 kWh
- Noise level: 39 dB
- Cooling: No Frost technology
AI Recommendations
CONTENT QUALITY
MARKET INTELLIGENCE
DISTRIBUTION
AI Recommendations
AUTOMATION STATUS
NEXT STEPS
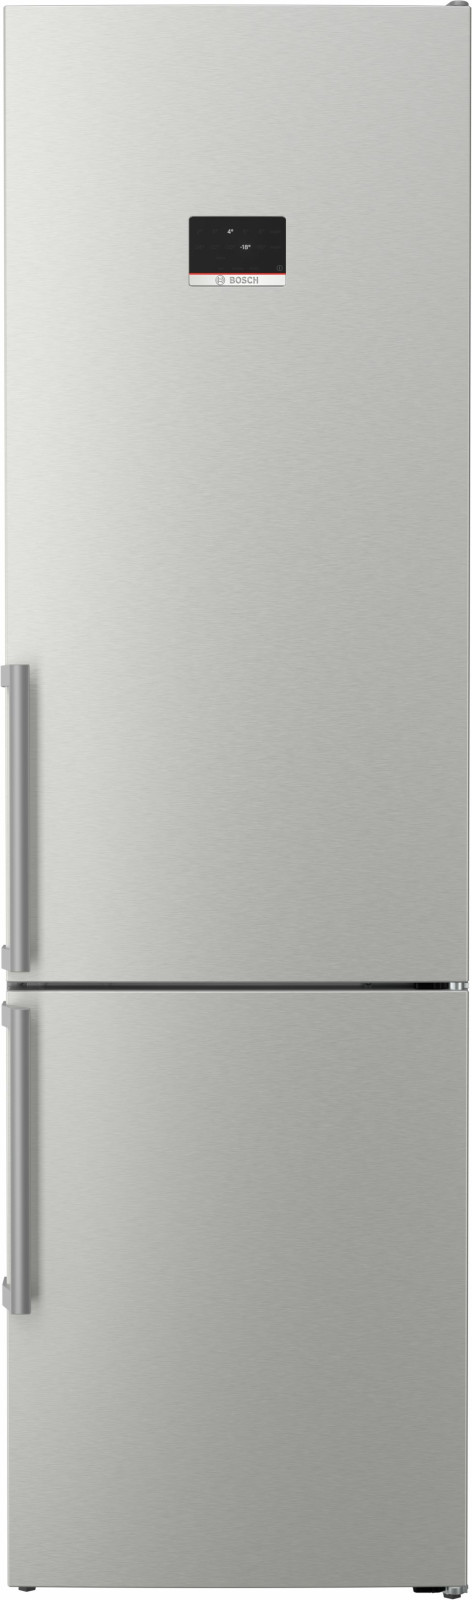
Bosch Refrigerator BPP300
Draft
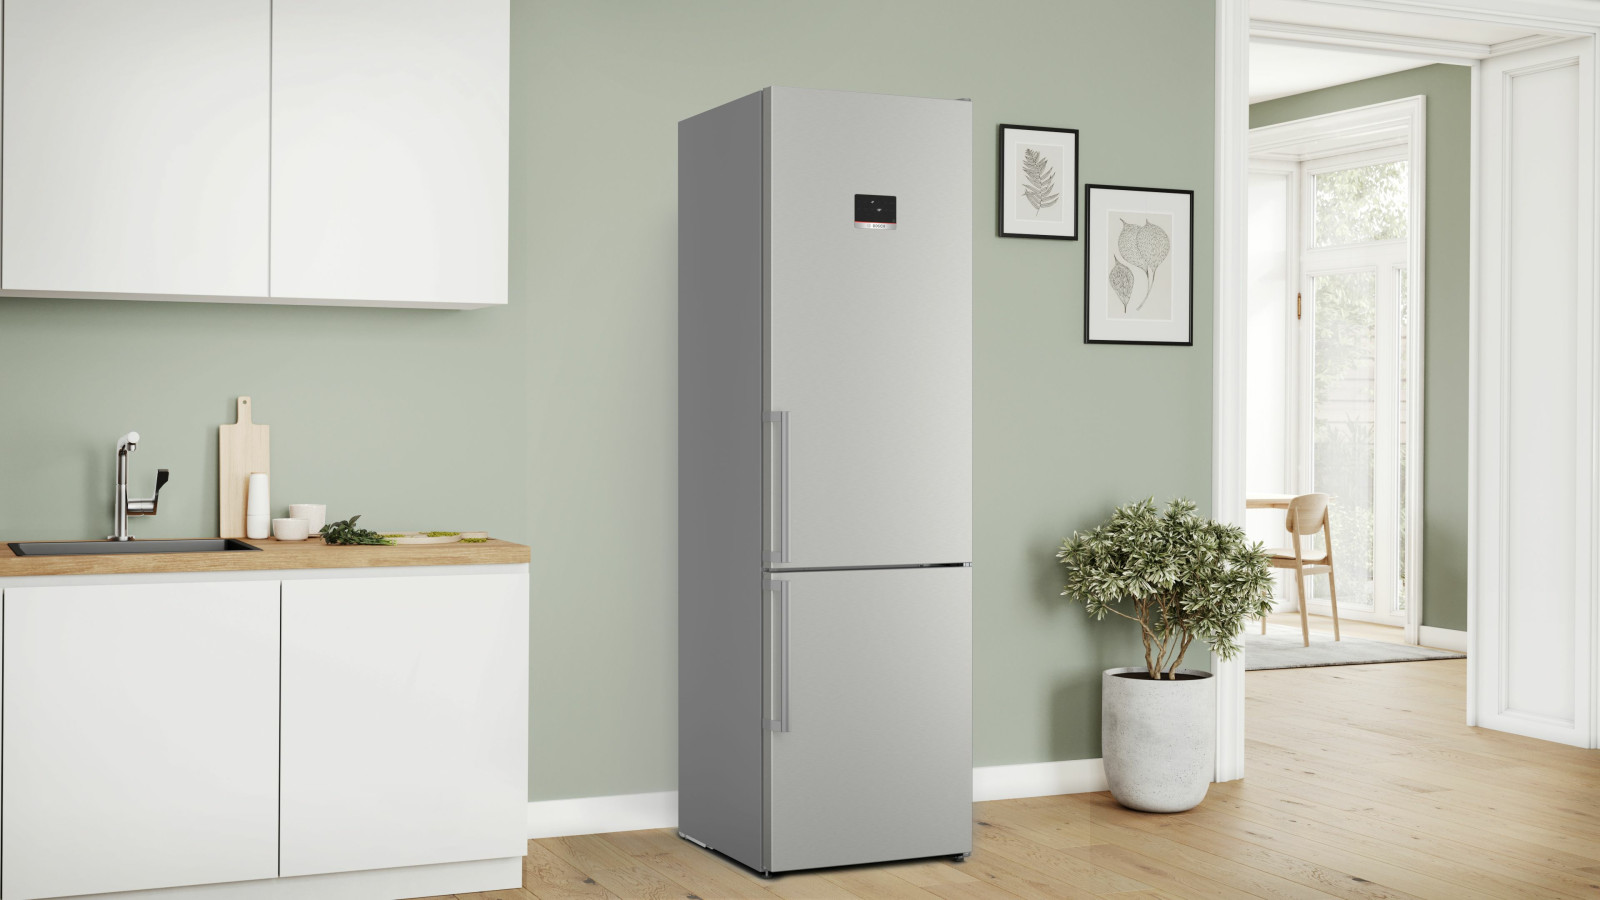
Experience German engineering excellence with the Bosch Series 4 BPP300, a premium combined fridge freezer that delivers uncompromising performance for the modern home. Built with Bosch's legendary attention to detail, this appliance combines sophisticated technology with elegant design to elevate your kitchen and food preservation experience.
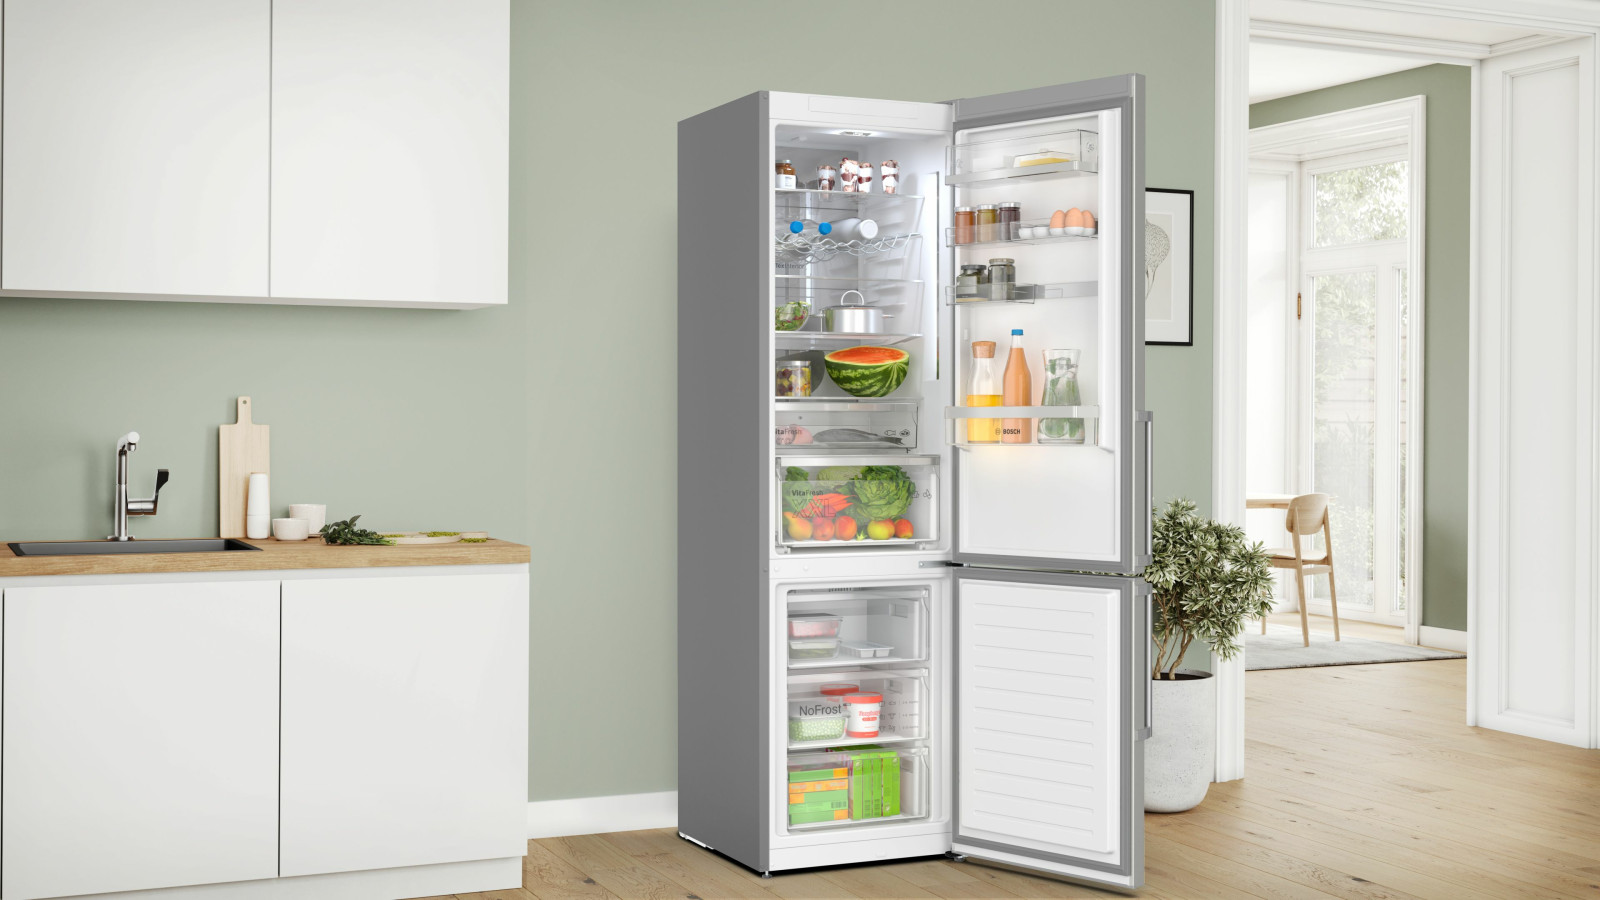
The BPP300 features a spacious 342-liter capacity, thoughtfully divided between refrigerator and freezer compartments to accommodate the needs of busy households. The advanced No Frost technology ensures consistent cooling throughout while eliminating ice buildup, freeing you from the tedious task of manual defrosting and guaranteeing optimal performance year after year.
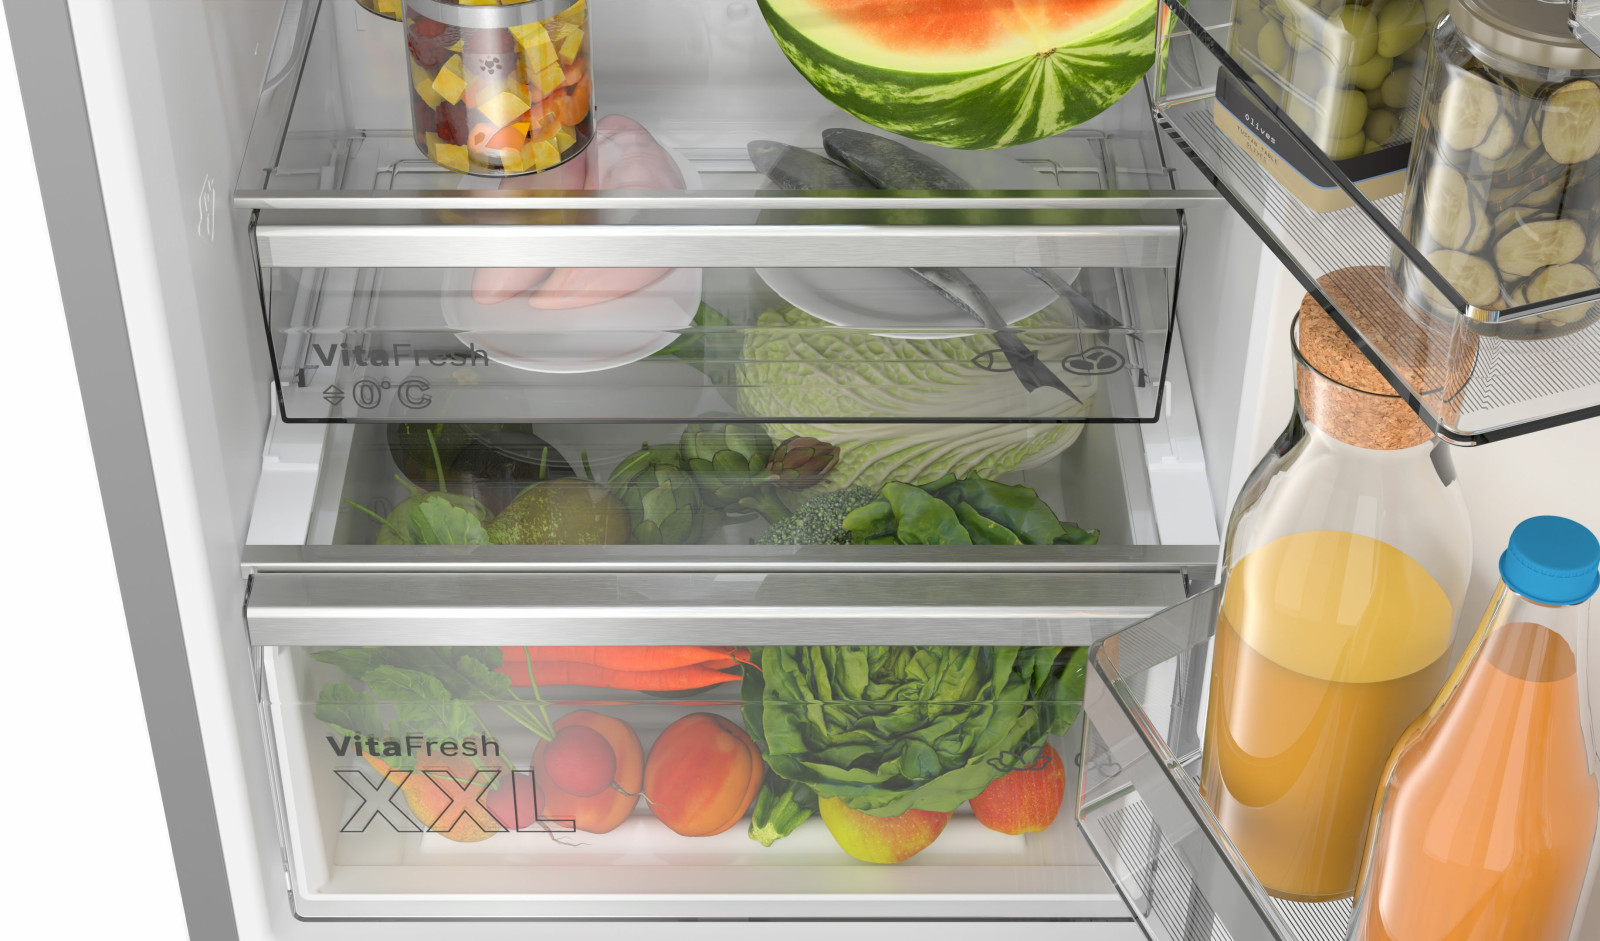
At the heart of this refrigerator is Bosch's innovative VitaFresh system, which creates specialized microenvironments with optimized humidity levels tailored to different food types. This precision climate control keeps fruits, vegetables, meats, and fish at peak freshness up to twice as long, helping reduce food waste while preserving nutritional value and flavor.
Design & Construction
- Finish: Anti-fingerprint stainless steel
- Installation type: Free-standing
- Door hinge: Reversible right/left
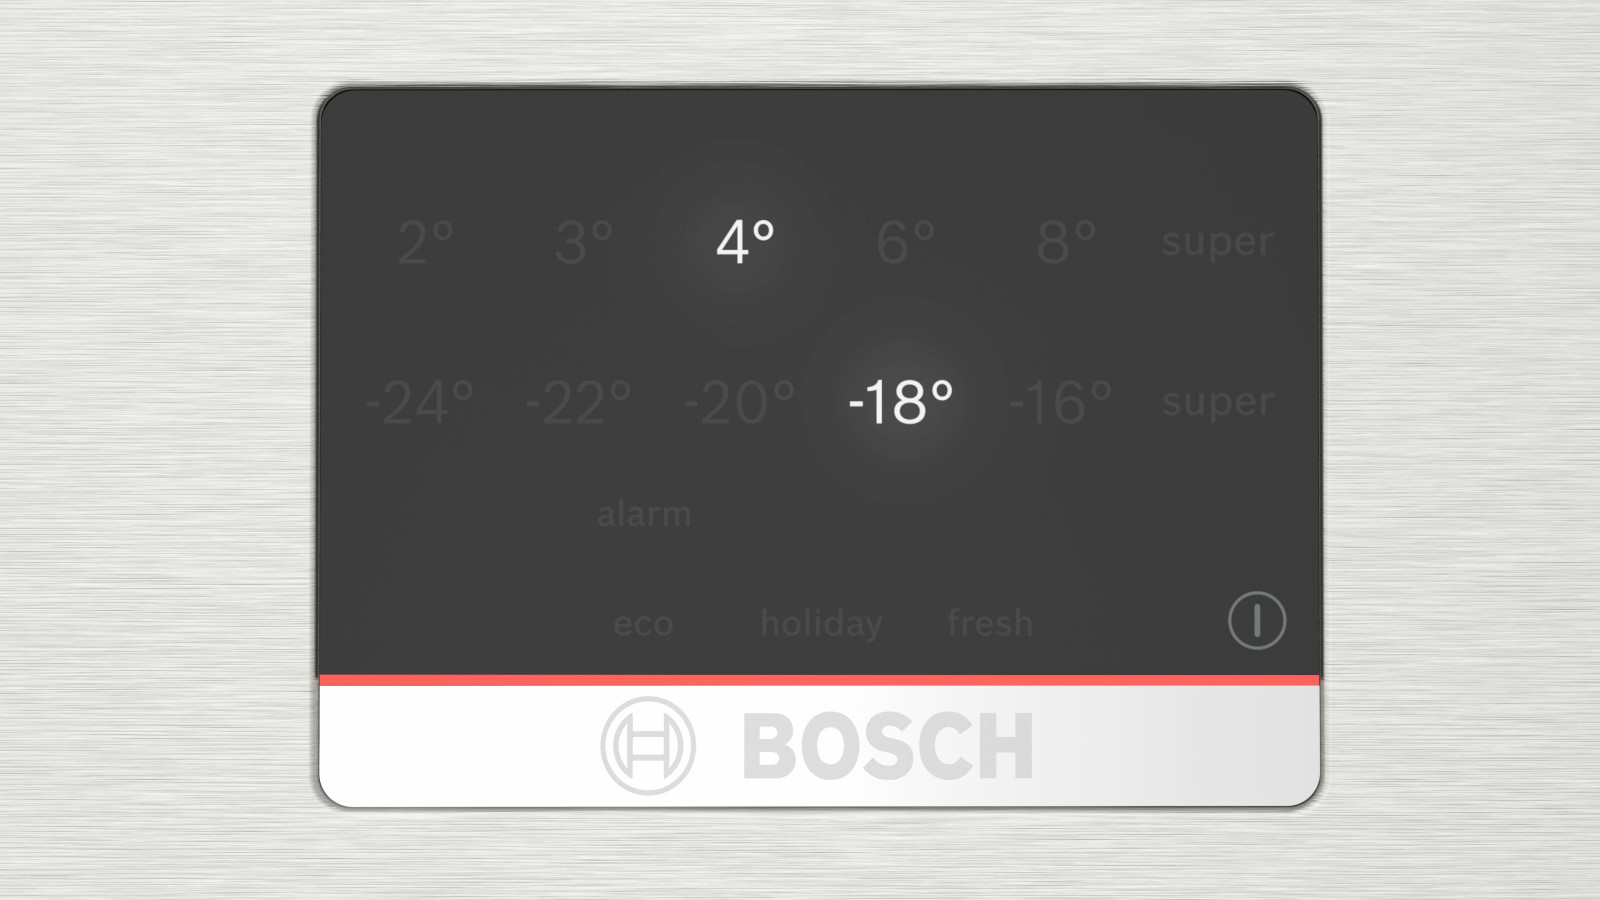
- Control system: Digital TouchControl
- Display: LED temperature display
Performance & Efficiency
- Energy efficiency class: A++
- Annual energy consumption: 260 kWh
- Noise level: 39 dB (Silent operation)
- Climate class: SN-T (10°C to 43°C)
- Cooling system: No Frost technology
Price Intelligence Enterprise
Competitor Auto-Tracking
AI Price Automation
Price has been automatically updated from $1,299.99 to $1,199.99 based on market analysis and dynamic pricing rules. This adjustment positions your product competitively against similar items while maintaining healthy margins.
Based on historical data, this price change is projected to increase conversion rate by 18% and overall revenue by 7% despite the lower margin. The system will continue monitoring competitor prices and adjust accordingly within your defined parameters.
This product listing has been optimized for Website, Amazon, and Best Buy channels. Each channel uses tailored content that maximizes performance based on platform-specific algorithms and buyer behavior patterns.
Amazon optimization focuses on search visibility and conversion with keyword-rich titles and bullet points. Best Buy optimization emphasizes technical specifications and comparative features. Website optimization balances brand voice with conversion elements.
Click "Expand to Walmart" to generate optimized content for the Walmart Marketplace that aligns with their specific requirements and search patterns.
Content is currently available in English (primary) and German. Other supported languages need content generation.
The AI localization system not only translates but culturally adapts content for each market, ensuring alignment with local buying habits and search patterns.
Product Creation
Drag & Drop Product Image
Or click to upload images of your product

Creating Product
Auto-Mapping Category
Analyzing store categories...Product Creation
Drag & Drop Product Image
Or click to upload images of your product
Creating Product
Auto-Mapping Category
Analyzing store categories...